In this previous post we saw a quick introduction to what is linear regression. In this post we will see how we can implement linear regression using R. We are planning to use the data used in our firstpost that is studentsdata. Would like to know more about how to load the data, please refer to my other blog post.
Step 1: Let’s have a look at data for various studentsdata using the command studentsdata which is loaded as per my another blog post.
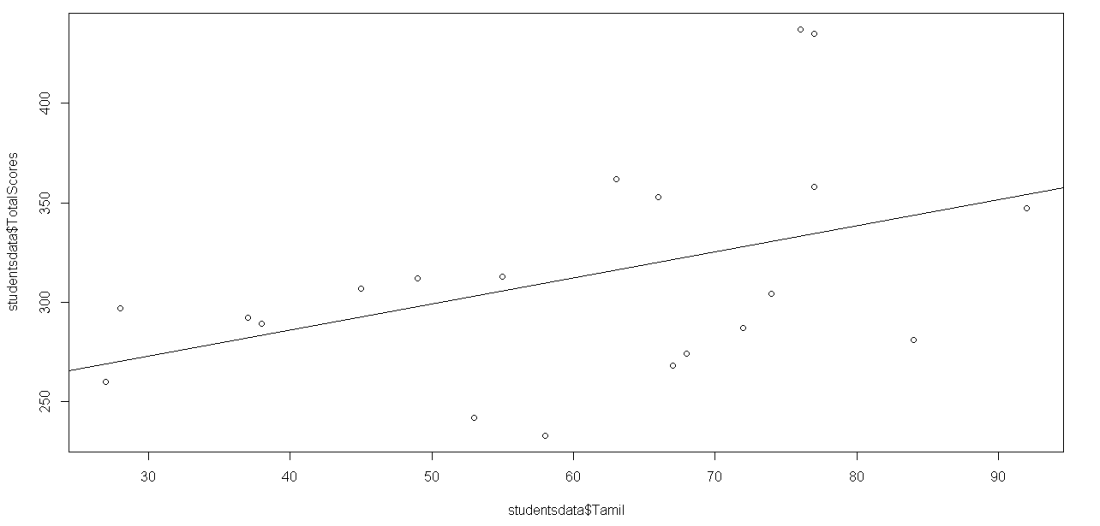
Step 2: We have stored the data in the table studentsdata now we will plot the marks of tamil and the total scores and see how they come along using the command plot(studentsdata$Tamil,studentsdata$TotalScores)
Step 3: It’s practically difficult to fit a perfect straight line in this case. So we will calculate and plot the line of Best fit or the Lease squares regression line. We will be using the lm Command to compute the linear model.
> res=lm(studentsdata$TotalScores~studentsdata$Tamil)
> abline(res)
> res
Call:
lm(formula = studentsdata$TotalScores ~ studentsdata$Tamil)
Coefficients:
(Intercept) studentsdata$Tamil
233.477 1.311
Step 4: You can see the plot done by abline here for the line of best fit.
Step 5: Prediction of total score using linear regression Now we have the line of best fit
TotalScore=studentdata$Tamil . 1.311 + 233.477
If you wish to predict the totalscore of a student who would be scoring 75 in tamil it would be as followes:
> 1.311*75+233.477
[1] 331.802
He/she would 331.80 total marks
