Key aspects of selecting visualization
There are many aspects of visualization of data. Many times we tend to get confused how to visualize a data and convey it either as meaningful insight or information which can be inferred upon. The selection visualization is critical from the following context:
- Easy of inference
- Ability to gain insights from visuals
- Helps in decision making
- Infer outliers and enable to act
- Simplify complex data situation
- Convey a story about the data
Case Study:
You are waiting in a railway station for a train, you know your train number you also have a planned time of departure but you wanted to understand the following while you wait:
- Will the train be on time ?
- Where is it currently located ?
- Any possibilities of delays expected ?
- What has been the history of timely arrivals in the past ?
- How long the train will halt in my current station ?
- Do we have accurate positioning of the coaches ?
- Am I standing at the right position to board my coach ? If not how far or how many steps I should I walk to reach the correct position ?
- Based on current speed of train what is the predictability of reaching my destination on planned time ?
- Does the coach I’m planning to board has facility for differently abled ?
So when we want to provide visualization to the end user we need to understand the Context/Questions to be answered/availability of data. Need to understand what is to be compared, filtered, correlated , data over time.
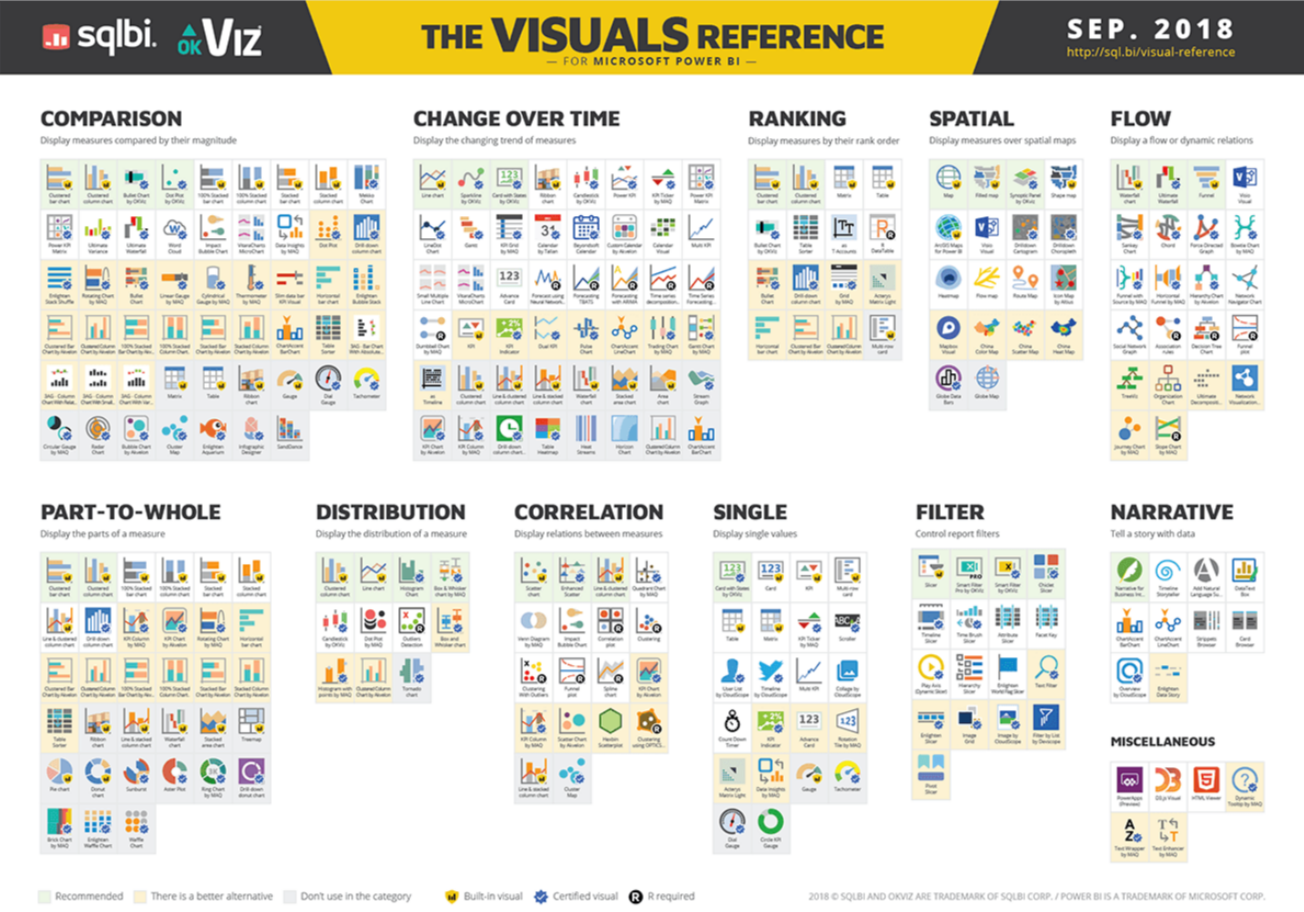
Where to look for some ideas: